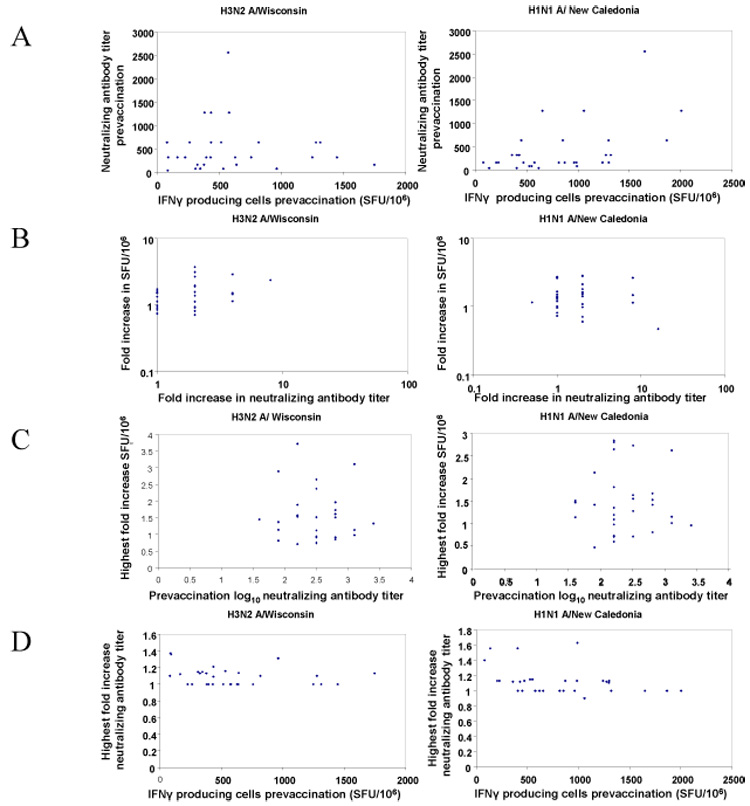
Figure 3.

Relationships between frequencies of IFNγ producing cells and the neutralizing antibody titers. All analyses were performed using linear regression analysis.
A- Correlations between the prevaccination numbers of IFNγ producing cells and prevaccination neutralizing antibody titers for H3N2 A/Wisconsin/67/05 prevaccination ( left, r2 = 0.003 p= 0.74 )and H1N1 A/New Caledonia virus/20/99 (right, r2 = 0.25 p=0.0049). SFU = spot forming units.
B- Correlations between the peak post-vaccination fold increases in the number of IFNγ producing cells and peak post-vaccination fold increases in neutralizing antibody titers for H3N2 A/Wisconsin/67/05 (left, r2 = 0.102 p= 0.083) and H1N1 A/New Caledonia virus/20/99 ( right, r2 = 0.001 p= 0.85). SFU = spot forming units.
C– Correlations between prevaccination neutralizing antibody titers and peak fold increase in IFNγ producing cells for H3N2 A/Wisconsin/67/05 (left, r2 = 0.005 p= 0.70) and H1N1 A/New Caledonia virus/20/99 (right, r2 = 0.00005 p= 0.97). SFU = spot forming units.
D- Correlations between prevaccination IFNγ producing cells and peak fold increase in neutralizing antibody titers for H3N2 A/Wisconsin/67/05 (left, r2 = 0.058 p= 0.196)and H1N1 A/New Caledonia virus/20/99 (right, r2 = 0 .132 p= 0.048). SFU = spot forming units
