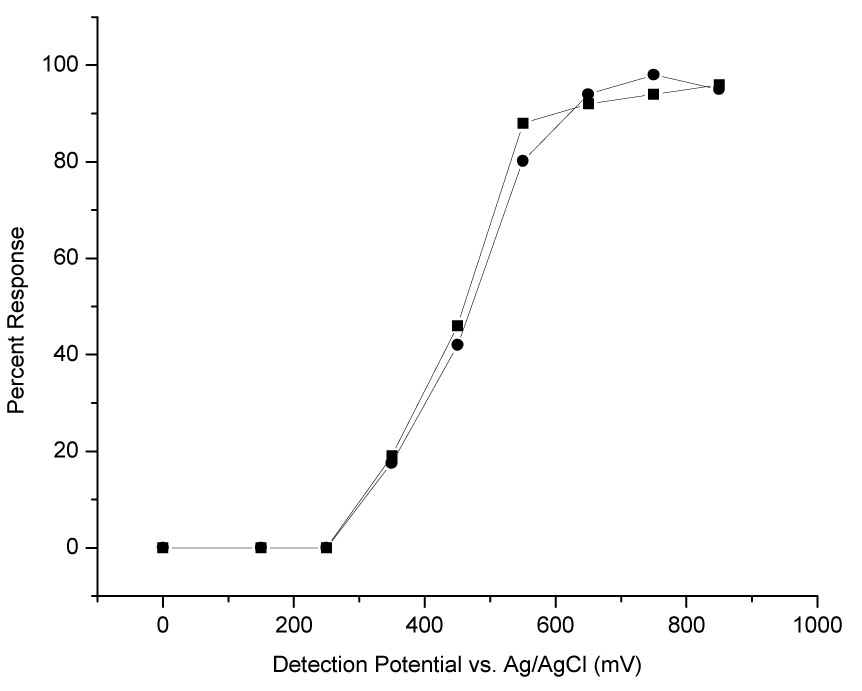
Figure 5.

Hydrodynamic Voltammograms of 8oxoG and 8OHdG. Conditions: 20 nM 8oxoG (■) and 8OHdG (●) standards in Ringer’s, all other conditions same as in Figure 4. Response measured in peak area.

Hydrodynamic Voltammograms of 8oxoG and 8OHdG. Conditions: 20 nM 8oxoG (■) and 8OHdG (●) standards in Ringer’s, all other conditions same as in Figure 4. Response measured in peak area.