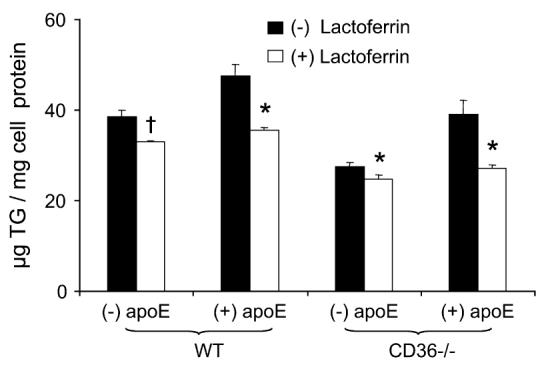
FIGURE 3.

Effects of lactoferrin and apoE on (n-3)-TGRP uptake in WT and CD36−/− peritoneal macrophages. Values are means ± SEM, n = 3 to 5 from a representative experiment. The effects of genotype (P < 0.001), apoE (P < 0.001), and lactoferrin (P < 0.001), and the interaction between apoE and lactoferrin (P < 0.01), were significant, but there was no significant interaction among genotype, apoE, and lactoferrin on the (n-3)-TGRP uptake values. † P < 0.05; *, P < 0.01 for comparison of presence vs. absence of lactoferrin in each genotype-apoE combination. To convert μg TG to μmol, divide by 946.
