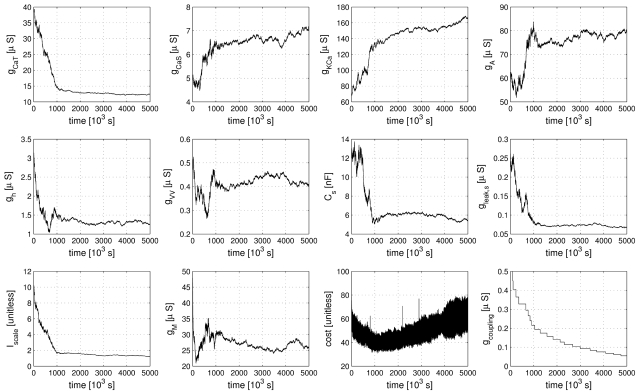
Figure 4. Evolution of 10 of the 20 estimated parameters (see text) during the fitting procedure.
Parameters tend to converge to a final value aided by a slow decrease of the size of explored parameter changes over the extent of the whole fitting procedure. The two bottom right panels show the composite cost function after each accepted parameter change (second to last panel) and the strength of the simulated electrical coupling (last panel, see Methods). The strong oscillations in the cost function are due to the model being compared to a different partial data set at each step of the parameter estimation procedure. The increase of the cost function in the late stages of the procedure are due to reductions in coupling strength which can only be partially compensated by the subsequent compensatory parameter changes and does not indicate a lack in convergence. In a sense, the stronger coupling earlier in the procedure feigns error function values that are lower than what can actually be achieved at lower coupling. The data displayed encompasses 4·105 simulated seconds and was produced in approximately 100 CPU days on an AMD Athlon 2200+ based platform.

