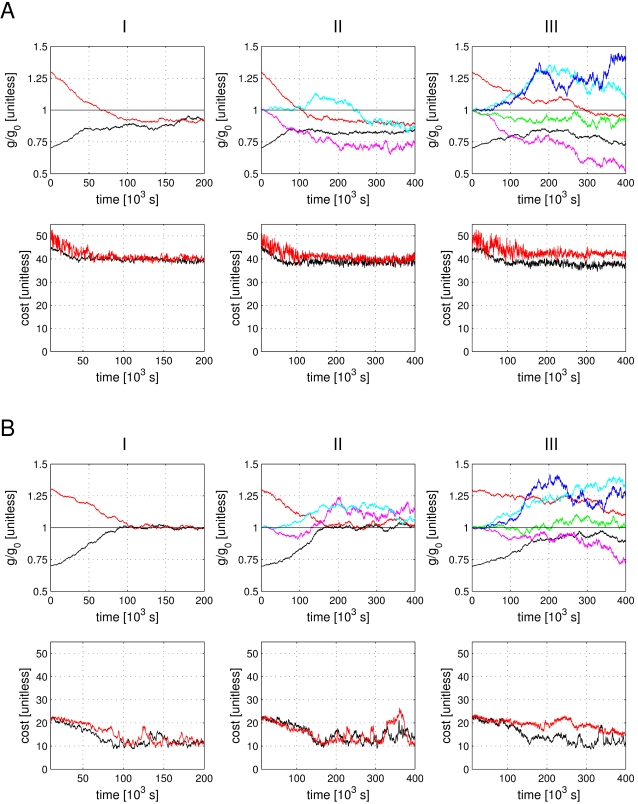
Figure 12. Refitting the model after a 30% change in the gCaT conductance.
A) The model was fitted to the data, after the transient calcium conductance gCaT was increased (red) or decreased (black) by 30%. I) Top panel, the evolution of gCaT and bottom panel the cost function during this re-fitting exercise. During the fit, only gCaT was allowed to change. II) Same as (I) but gA was released for fitting (magenta and cyan for up and down change of gA respectively). III) In addition to gCaT and gA, gKCa was allowed to be fitted (blue and green). B) Parameter and cost function evolution as in (A), while the model was fitted to its own output data. The colors and the panel arrangement are the same as in (A).

