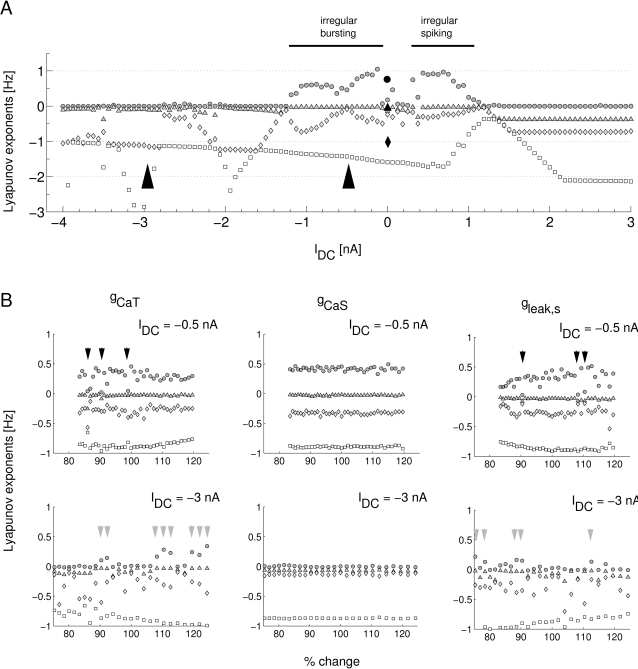
Figure 13. A) The 4 largest Lyapunov exponents of the LP neuron model as functions of the current injection IDC.
The largest exponent is 0 outside the interval [−1.2,1.2]nA and in a small region around 0 nA. The positive maximal Lyapunov exponent in the two intervals in between indicates two wide regions of chaoticity. From inspecting the raw data we can identify the dynamics in the two regions to be chaotic bursting for IDC∈[−1.2,−0.2]nA and chaotic spiking for IDC∈[0.2,1.1]nA. The larger, black symbols are the published exponents that were calculated directly from a long recording of an isolated LP neuron at IDC = 0 [20]. B) Persistence of chaoticity or non-chaoticity for changes in conductance parameters. The upper row shows the 4 largest Lyapunov exponents as a function of the percentual parameter change in gCaT (left), gCaS (middle), and gleak,s (right) at IDC = −0.5 nA. The largest Lyapunov exponent is positive for an overwhelming number of parameters indicating that chaoticity typically persists at IDC = −0.5 nA even if parameters are changed. However, there are some exceptional parameter values (black arrowheads) for which the largest Lyapunov exponent is not unambiguously greater than 0 indicating that the corresponding models are non-chaotic. In the non-chaotic region of IDC = −3 nA the largest Lyapunov exponent is 0 for most parameter values and the models are thus non-chaotic. Again, there are some exceptions of isolated parameter values with different model behavior (grey arrowheads).

