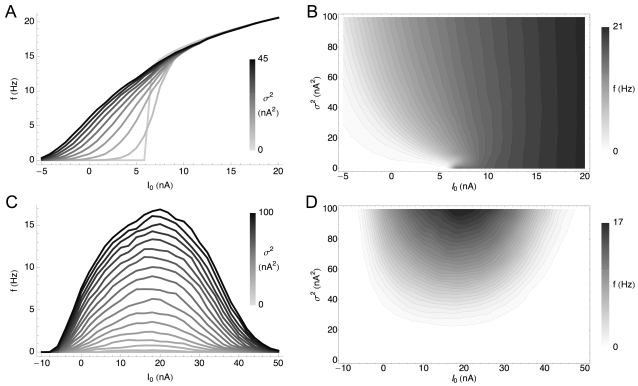
Figure 1. Variance-Dependent Gain Modulation of the HH and HHLS Model.
Each model is simulated as described in the Materials and Methods section. (A) f-I curves of a standard HH model for differing 10 variances (σ2) from 0 to 45 nA2. The topmost trace is the response to the highest variance. Each curve is obtained with 31 mean values (I 0) ranging from −5 to 20 nA. (B) The same data as (A) plotted in the (mean, variance) plane. Lighter shades represent higher firing rates. We used cubic spline interpolation for points not included in the simulated data. (C,D) f-I curves of the HHLS model as in (A) and (B). 10 means from −10 to 50 nA and 21 variances from 0 to 100 nA2 are used.

