
Figure 8.
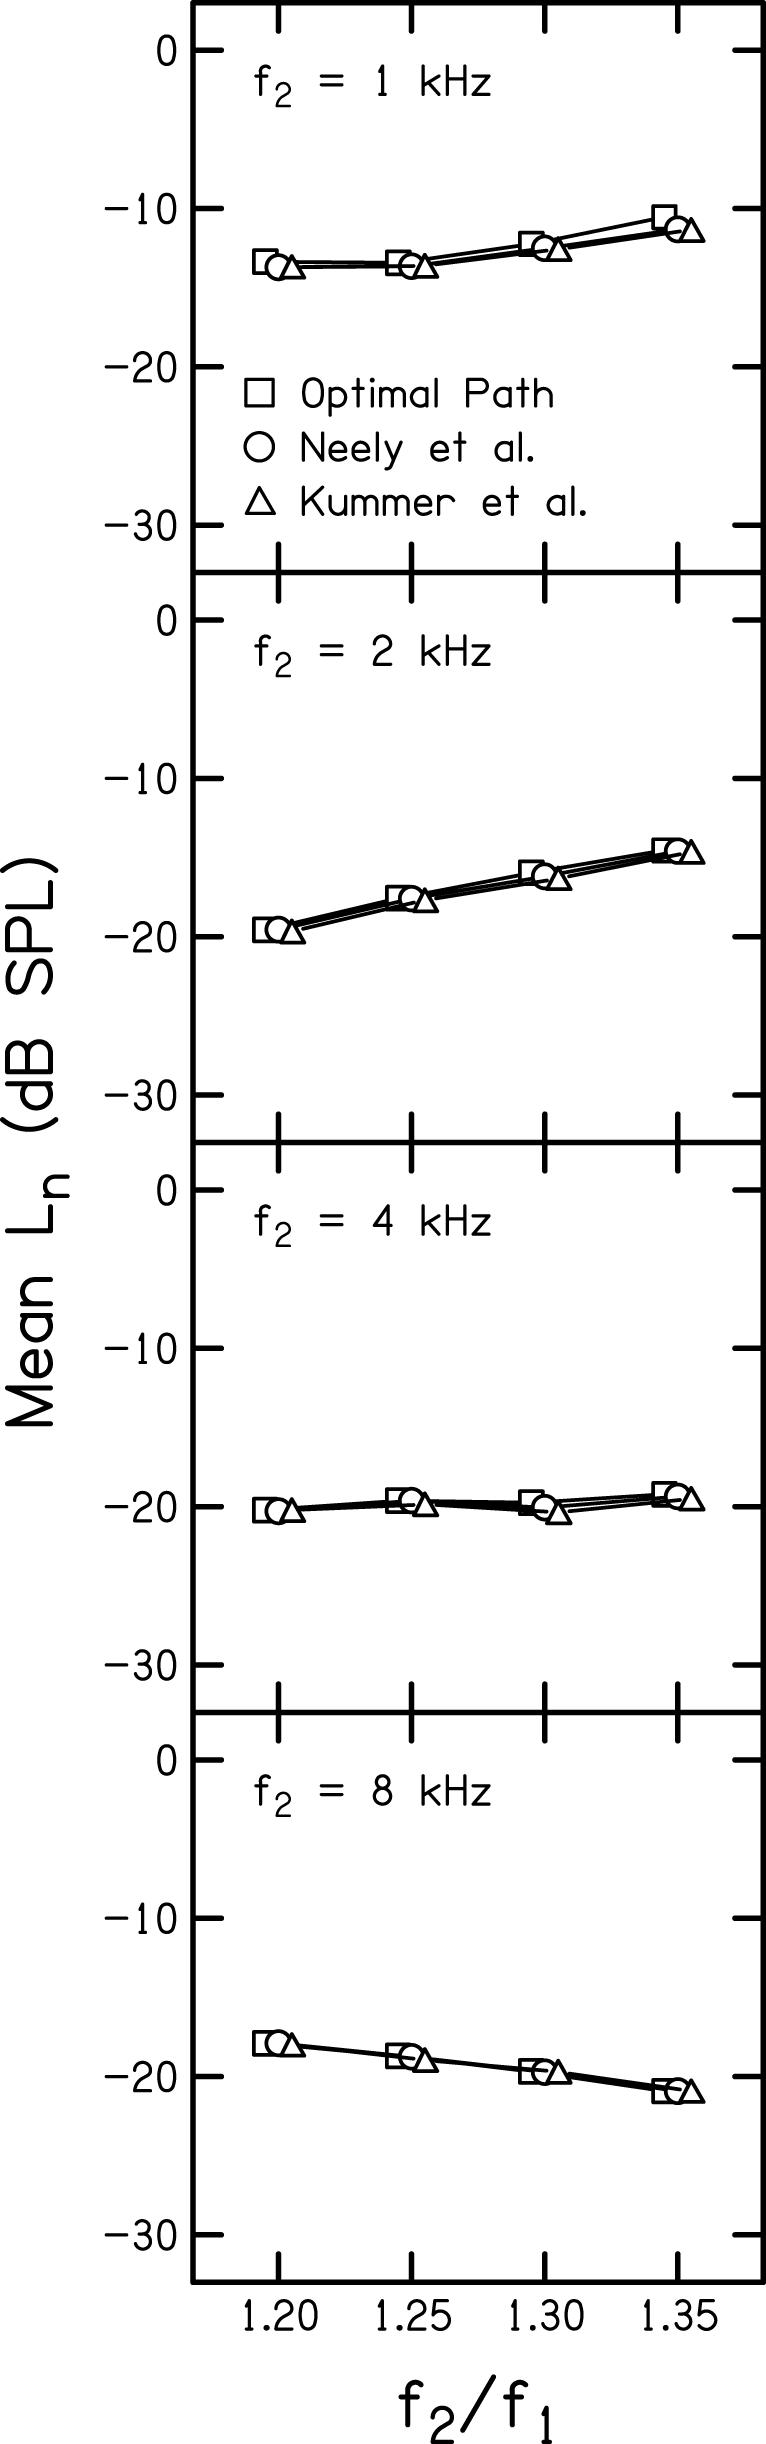
DPOAE noise levels (Ln) as a function of frequency ratio with each panel corresponding to a different f2. Each symbol corresponds to a different L1, L2 path as indicated in the legend.
Official websites use .gov
A
.gov website belongs to an official
government organization in the United States.
Secure .gov websites use HTTPS
A lock (
) or https:// means you've safely
connected to the .gov website. Share sensitive
information only on official, secure websites.
DPOAE noise levels (Ln) as a function of frequency ratio with each panel corresponding to a different f2. Each symbol corresponds to a different L1, L2 path as indicated in the legend.