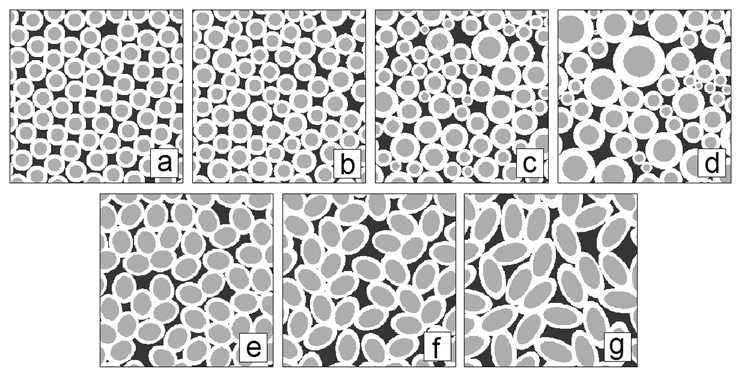
Figure 1.
Synthetic circular axon images generated with a Gaussian distribution of diameters (mean and standard deviation are µ and σ respectively): a) σ/µ = 0.0, b) σ/µ = 0.1, c) σ/µ = 0.25, d) σ/µ = 0.5. The white rings signify myelin. The mean axon diameter (excluding myelin) was held constant at 14.48 µm. Synthetic ellipsoidal axon images generated with different ratios (R) of major axis over minor axis lengths e) R = 1.25, f) R = 1.5, g) R = 2.0. The mean axon diameter (excluding myelin) was held constant at ~25 µm.

