
Figure 3.
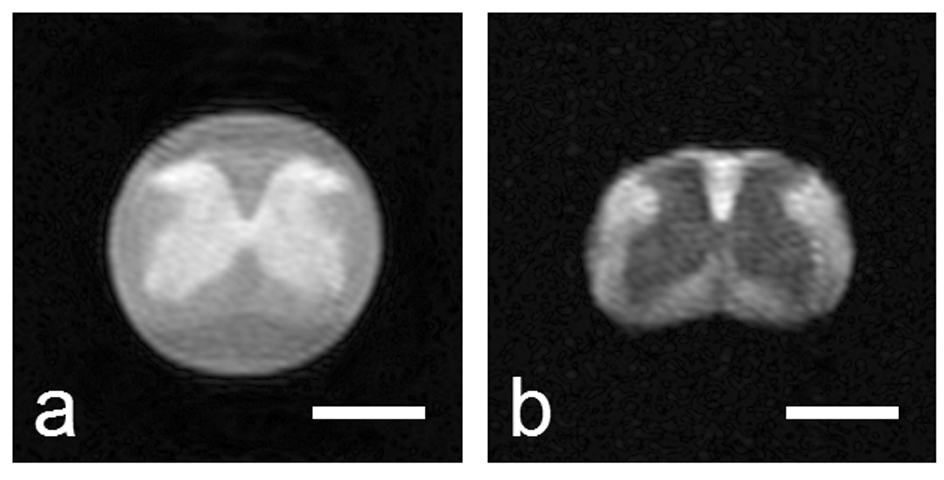
Sample diffusion-weighted stimulated echo magnitude images (Δ/δ = 10/0.4 ms) at two different q-values: 0 and 0.12 µm−1. The white bar represents a length of 1 mm. Note the fluid surrounding the spinal cord, which exhibits free diffusion, is attenuated to background intensity in b).