
Figure 4.
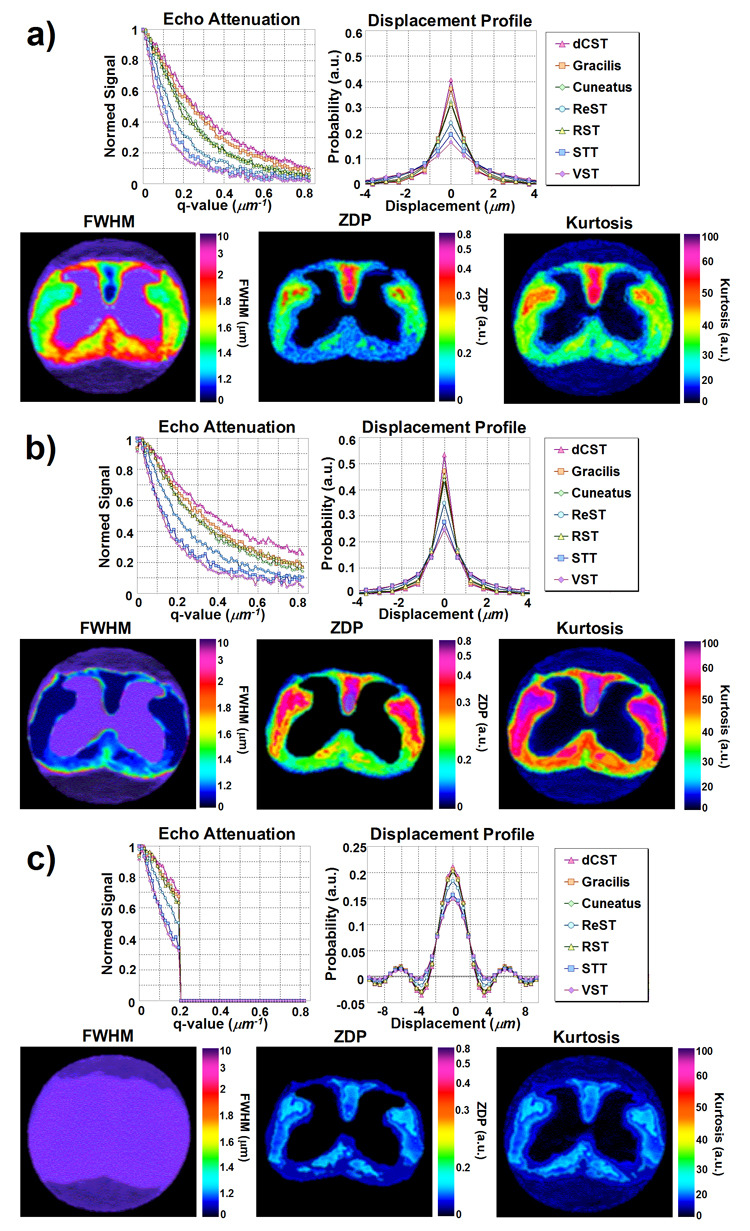
Sample q-space echo attenuation plots and displacement profiles for seven WM tract ROIs, alongside with sample FWHM, zero-displacement probability (ZDP), and kurtosis maps under experimental parameters with a) high displacement resolution (qmax = 0.82 µm−1) and fulfilling the narrow gradient pulse condition (Δ/δ = 10/0.4 ms), b) high displacement resolution (qmax = 0.82 µm−1) and failing to fulfill the narrow gradient pulse condition (Δ/δ = 10/5 ms), and c) low displacement resolution (qmax = 0.21 µm−1) and failing to fulfill the narrow gradient pulse condition (Δ/δ = 10/5 ms). The fourth case of low displacement resolution (qmax = 0.21 µm−1) and fulfilling the narrow gradient pulse condition (Δ/δ = 10/0.4 ms) was excluded to its similarity with c).