
Figure 6.
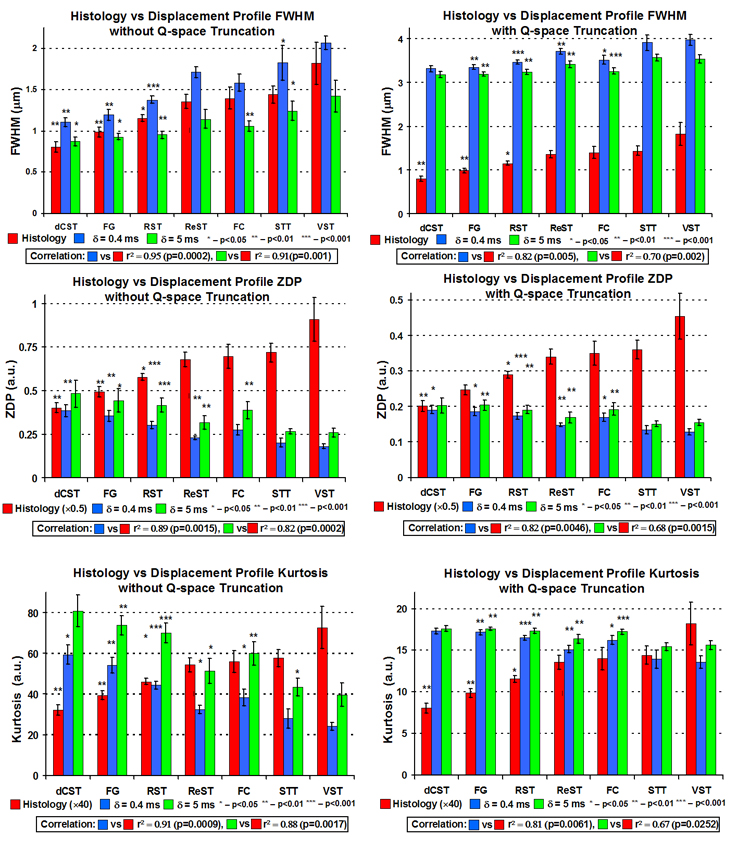
Summary plots of q-space experiments showing mean axon diameter calculated from histology, FHWM, zero-displacement probability (ZDP), and kurtosis values for each WM tract averaged over all five specimens under experimental conditions fulfilling and not fulfilling the SPGA and with and without q-space truncation (to simulate low displacement profile resolution). Each asterisk represents the p-value of a paired t-test comparison with the next similar colored bar to the right.