
Figure 7.
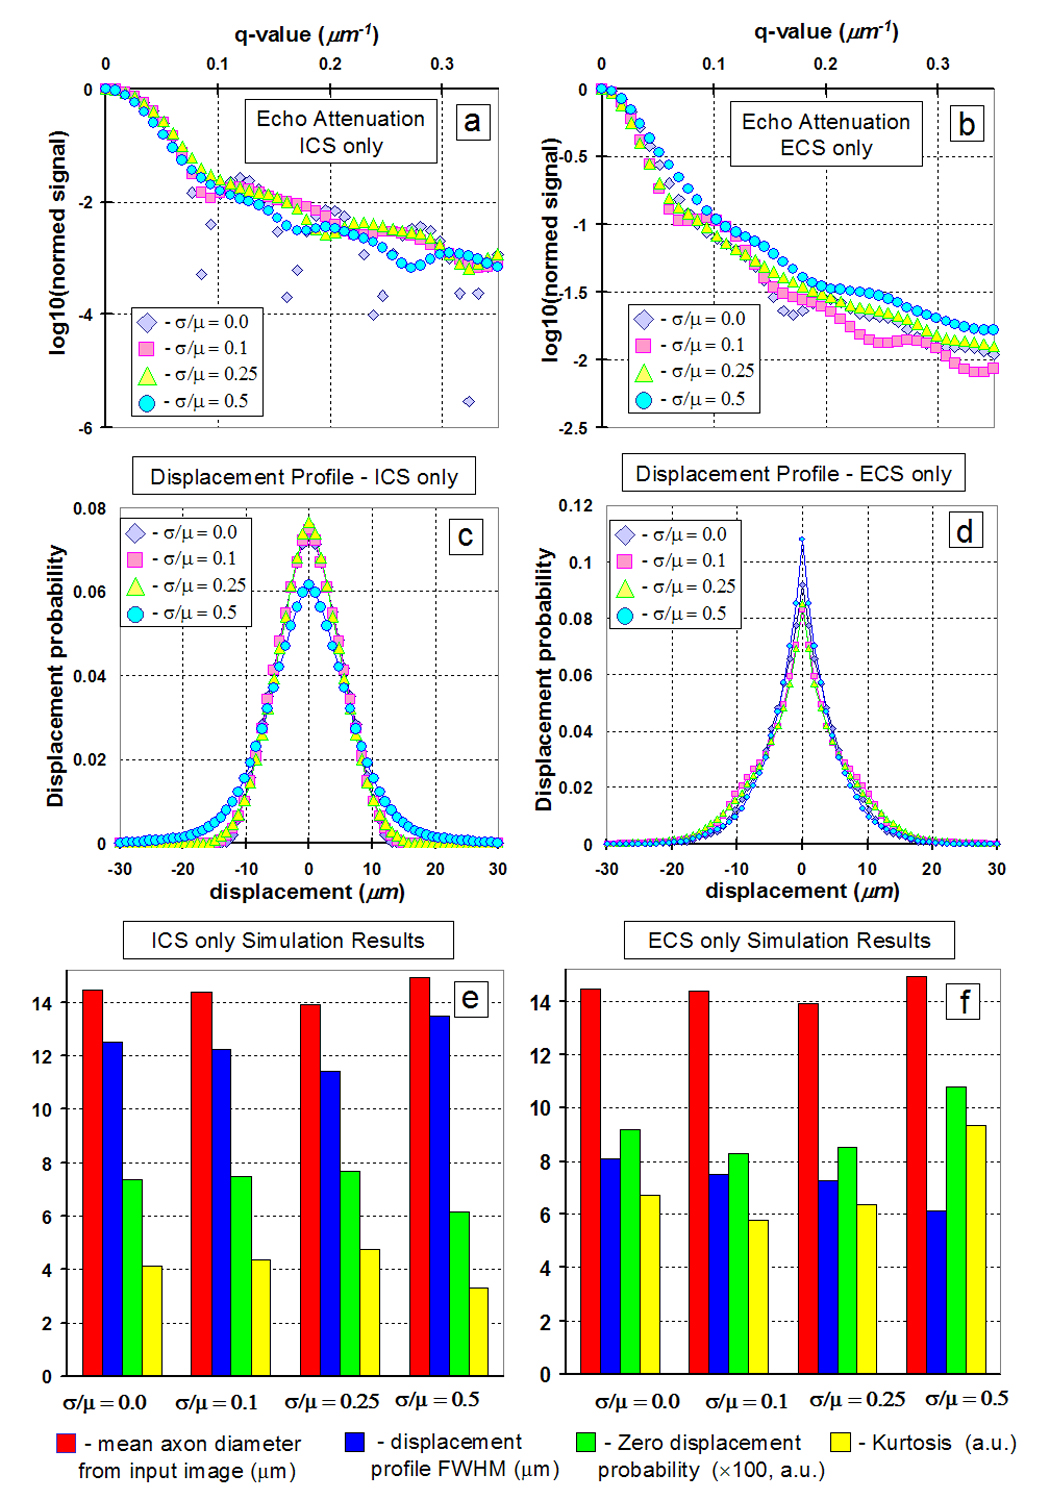
Summary of simulation results for synthetic circular axons of varying diameter mean and standard deviation ratios (µ and σ respectively). a) Echo attenuation for signal from ICS only. b) Echo attenuation for signal from ECS only. c) Displacement profile for signal from ICS only. d) Displacement profile for signal from ECS only. Mean axon diameter, FWHM, zero displacement probability, and kurtosis for e) signal from ICS only and f) signal from ECS only.