
Figure 9.
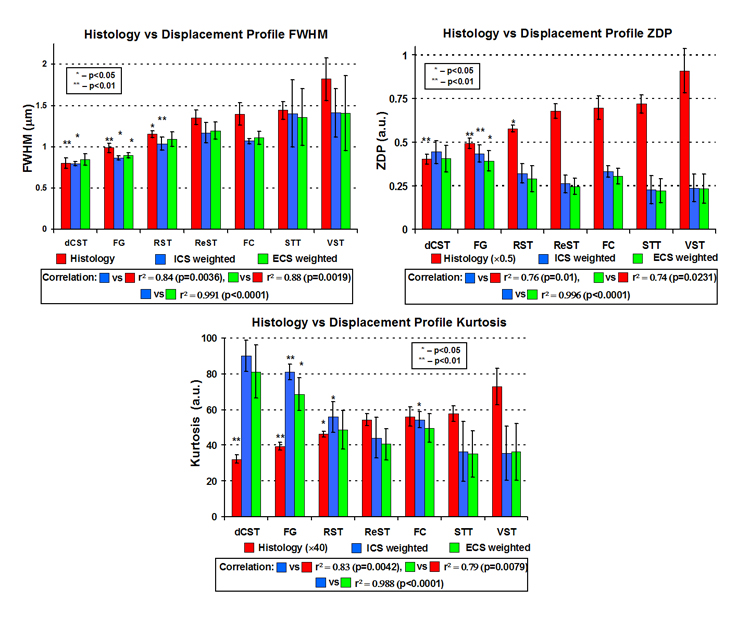
Summary plots of q-space simulations based on histologic images showing mean axon diameter calculated from histology, FHWM, zero-displacement probability (ZDP), and kurtosis values for each WM tract averaged over all five specimens under simulation conditions of ICS weighted signal and ECS weighted signal. Each asterisk represents the p-value of a paired t-test comparison with the next similar colored bar to the right.