
Figure 1.
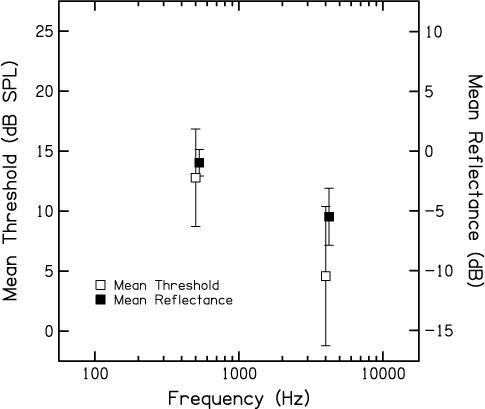
Mean behavioral threshold in dB SPL (left Y-Axis) and mean middle-ear reflectance in dB (right Y-Axis) as a function of frequency. Open symbols represent behavioral thresholds and filled symbols represent reflectance data. In both cases, error bars represent ± 1 SD. Data are shown for both f2 frequencies (0.5 and 4 kHz). Data points representing behavioral thresholds and reflectance are offset slightly to allow for easier visualization.