
Figure 2.
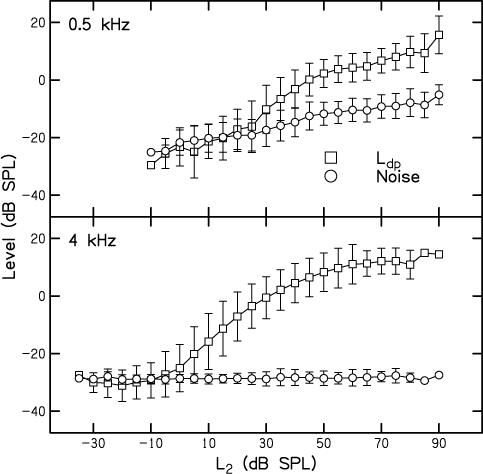
Top: Mean DPOAE level (Ldp) (circles) and noise level (squares) in dB SPL as a function of L2 in dB SPL when f2 = 4 kHz. Bottom: Mean DPOAE level (Ldp) (circles) and noise level (squares) in dB SPL as a function of L2 in dB SPL when f2 = 0.5 kHz. In all cases, error bars represent ± 1 SD. Because stimuli were presented relative to each subject's threshold, L2 was rounded to the nearest 5 dB prior to calculating the mean values shown in this figure.