
Figure 5.
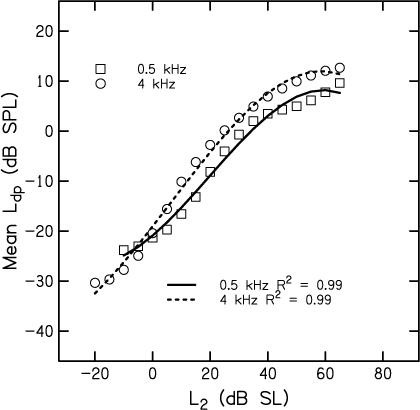
Mean Ldp in dB SPL as a function of L2 in dB SL, following the symbol conventions used in Figs. 2, 3, and 4. Lines represent polynomial fits to the mean data, with the solid line representing the fit to data at 0.5 kHz and the dashed line representing the fit to data at 4 kHz. Proportion of the variance accounted for is provided as an insert in the figure.