
Figure 6.
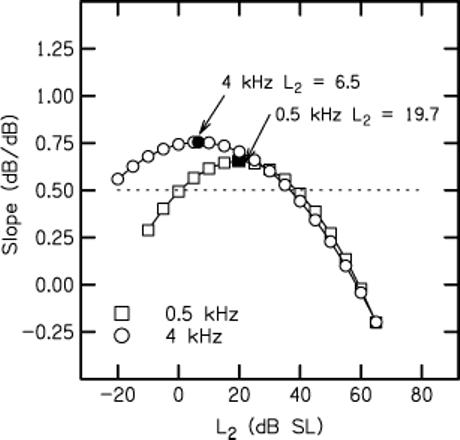
Slope (dB/dB) as a function of L2 in dB SL derived from the polynomial fits that were shown in Fig. 5. Symbol convention is the same as in previous figures. Filled symbols on each curve represent the point at which the maximum slope was achieved. Horizontal dashed line drawn at a slope of 0.5 was used as a definition of dynamic range.