
Fig. 4. Laforin expression and cancer susceptibility to energy-deprivation.
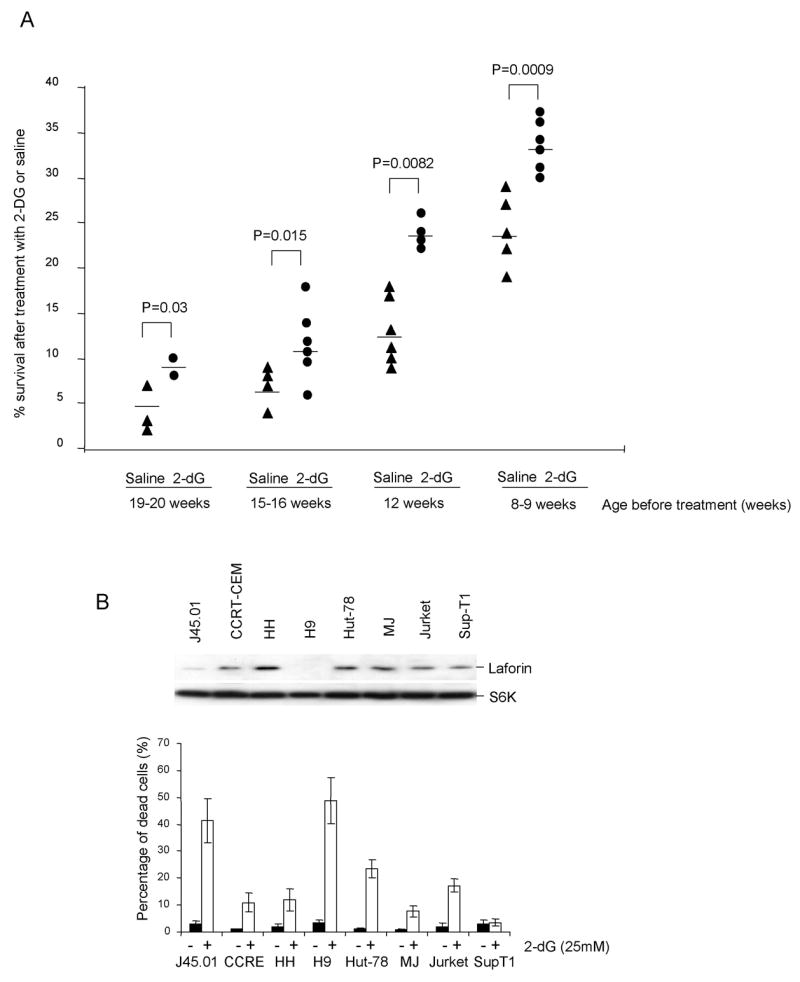
A. 2-dG treatment significantly increases the life span of the TGB mice that develop lymphoma due to genetic and epigenetic defects of the Epm2a gene. TGB mice were grouped and paired according to age and treated with either PBS or 2-dG at the dose of 20mg/mouse/3day at the beginning week, and then 20mg/mouse/week in the following 1month until moribund or death. Data shown indicate the life span after initiation of treatment. B. Inverse correlation between LAFORIN levels and cellular response to 2-dG-treatment. The upper panels show the levels of LAFORIN as determined by Western blot, using total S6K as a loading control. The lower panel shows % of cells with less than 2C DNA contents, as determined by flow cytometry. Data shown are means and S.D. and have been repeated twice.