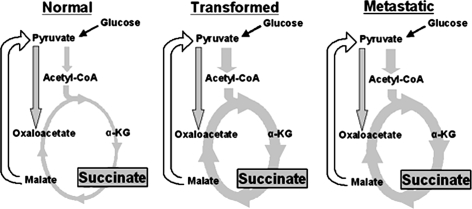
Fig. 4.
Relative distribution of the TCA cycle in MCF10 cells. Flux through the TCA cycle and the pool size of succinate are higher in tumorigenic cells than in untransformed cells. Observed metabolites are boxed in grey and their relative sizes between tumorigenic states are roughly proportional to the observed pool sizes. Observed fluxes are shown as grey arrows and their widths are roughly proportional to the relative pathway flux. See Table 1 for values. Normal is the MCF10-A cells; transformed is the MCF10-AT cells; metastatic is the MCF10-CA1a cells. α-KG = α-ketoglutarate

