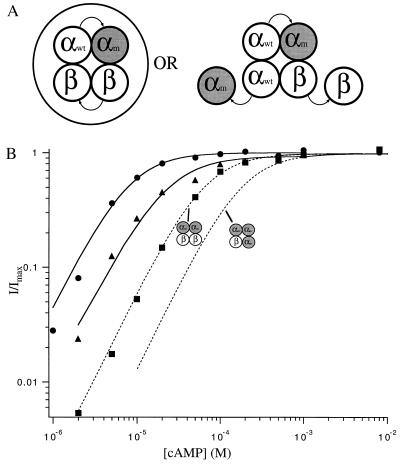
Figure 4.
(A) Schematic diagram of how αwtαm and ββ dimer coinjections could produce channels with an arrangement of two α-subunits and two β-subunits (Left) or three α-subunits and one β-subunit (Right). (B) Dose–response data for activation by cAMP of channels from coinjection of αwt and β monomers (circles), αwtαm and ββ dimers (triangles), and αm and β monomers (squares). The solid lines are the Hill fits to the αwt and β monomer data and the αwtαm and ββ dimer data. For αwt and β monomers, K1/2 = 7.7 μM and n = 1.5. For αwtαm and ββ dimers, K1/2 = 22 μM and n = 1.4. For αm and β monomers (Hill fit not shown for clarity), K1/2 = 63 μM and n = 1.5. The dashed line on the left is the prediction (see Methods) for the α-α-β-β arrangement shown on the Left in A and is a Hill equation curve with K1/2 = 63 μM and n = 1.5. The dotted line on the right is the prediction for the α-α-α-β arrangement shown on the right in (A), and is a Hill equation curve with K1/2 = 178 μM and n = 1.5. The encircled arrangement is the one best supported by the data.

