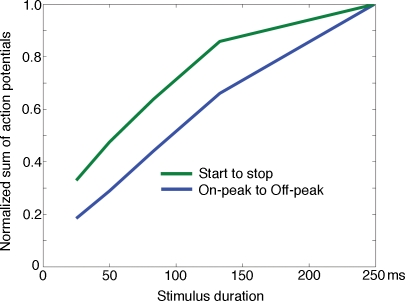
Figure 7. Predicting the stimulus duration from the spike trains.
For all spike trains having significant firing (p<0.01) the number of spikes were summed from the first significant bin to the last significant bin (irrespective if the firing between the ON and OFF responses was significant) for each condition. The maximal sum for each animal was set to 1.0 and the other sums normalized accordingly. This gave the green curve: start-stop. The blue curve was calculated similarly, but such that the sum of spikes was only taken between the peak of the ON response and the OFF response: peak-to-peak.

