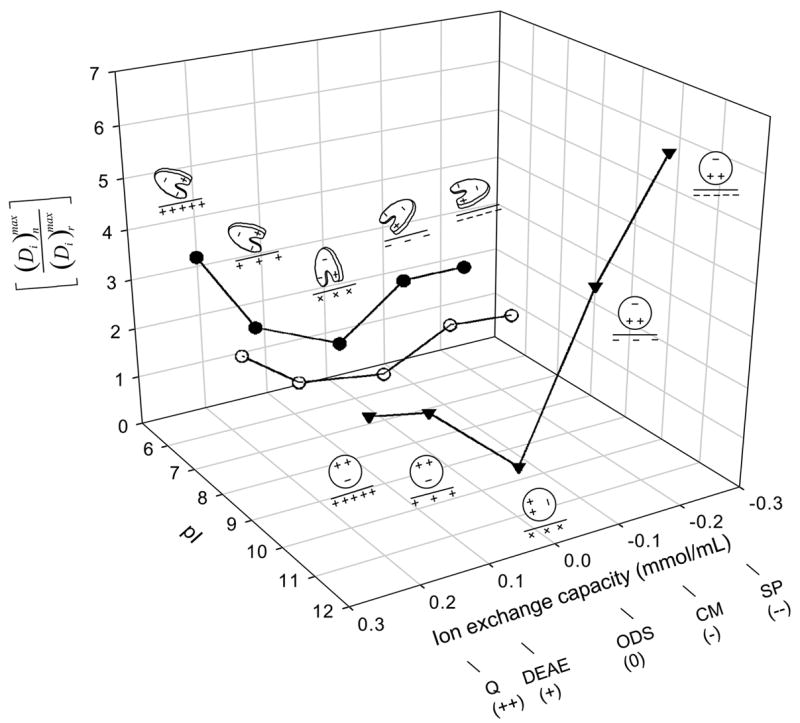
Figure 2.

Relationship among protein pI (HSA, closed circles; IgG, open circles; Lys, inverted triangles), adsorbent ion-exchange capacity (++ = strong anion exchanger, + = weak anion exchanger, neutral = ODS, − = weak cation exchanger, −− = strong cation exchanger; see Table 2 for adsorbent identities), and adsorbent-capacity ratio that measures the excess amount of protein adsorbed to ion-exchange surfaces n over the neutral reference surface octadecyl sepharose (ODS, surface r). Notice that trends in were consistent with a simple electrostatic-interaction interpretation suggested by protein-cartoon insets shown for HSA and Lys (IgG not diagrammed for the sake of clarity). Lines through the data points are guides to the eye.
