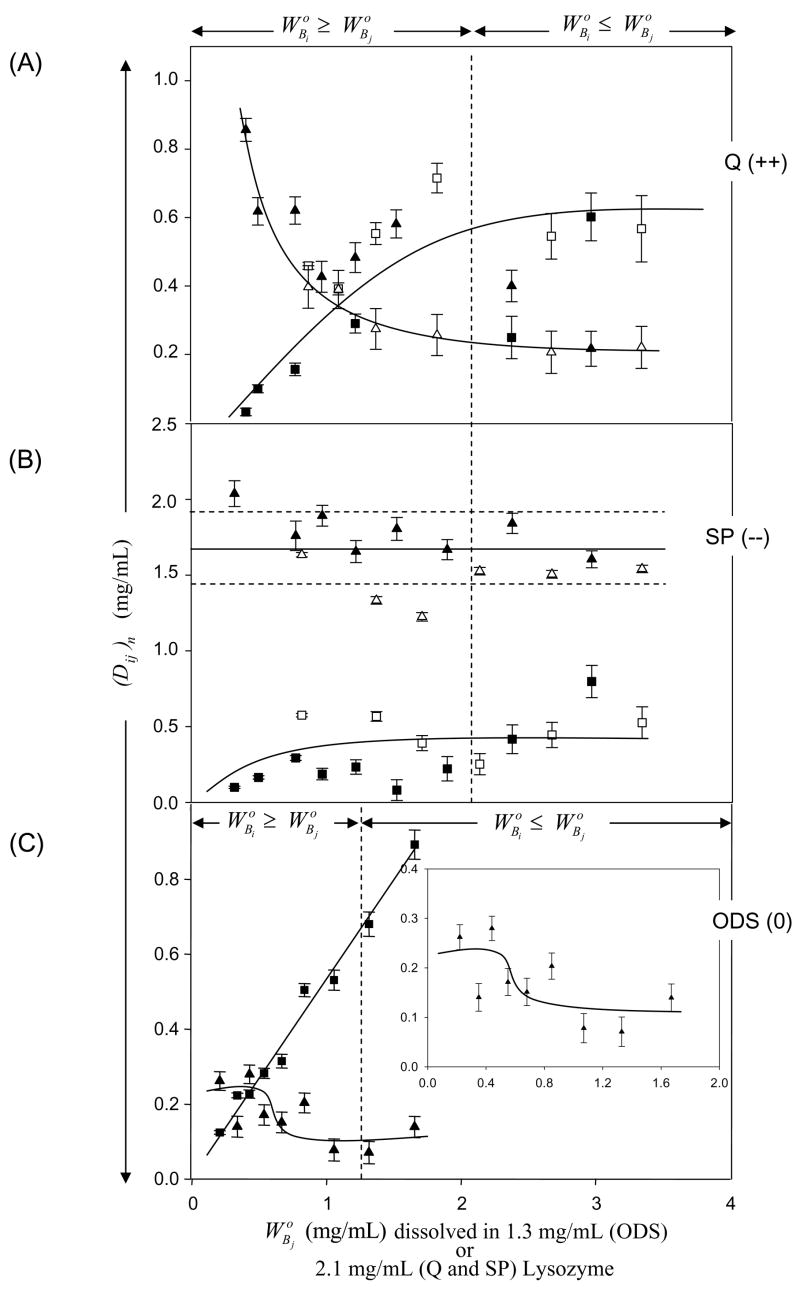
Figure 4.
Adsorption competition between Lys and IgG adsorbing to (Panel A) quarternary-ammonium sepharose (Q; a positively-charged, strong anion exchanger, +0.22 mmol/mL exchange capacity), (Panel B) sulfopropyl sepharose (SP; a negatively-charged, strong cation exchange resin, −0.22 mmol/mL exchange capacity), or (Panel C) octadecyl sepharose (ODS; a neutral hydrophobic resin, 0 mmol/mL exchange capacity; see Table 2 for adsorbent identities). Ordinate simultaneously plots solution depletion of Lys (protein i, triangles) and IgG (protein j, squares) with the parameter (Dij)n for each of the n surfaces at different IgG solution concentrations mg/mL in surface-saturating Lys solution concentrations = 1.3 mg/mL for ODS or = 2.1 mg/mL for Q and SP (see section 2 for details). Open and closed symbols represent different trials with the same protein. Error bars on symbols represent estimated uncertainty calculated by propagation of error in calibration curves relating SDS gel electrophoresis band optical density to protein concentration (see section 2 and ref. [3] for more discussion of analytical methods). Dashed vertical lines and annotations note the solution concentration range when protein i exceeds that of protein j and solid lines through the data are guides to the eye. Notice that adsorption of net-neutral IgG was at the expense of Lys on Q and ODS but not SP. Trends in Lys adsorption on ODS are analytically difficult to discern because the surface capacity falls within technique sensitivity limits.

