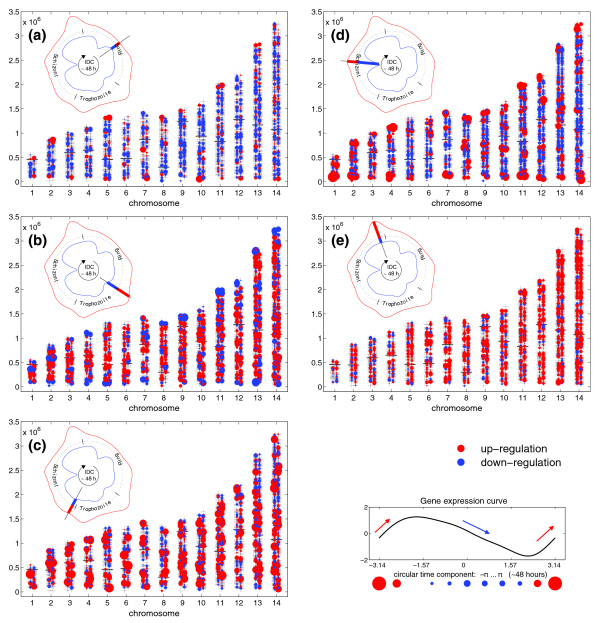
Figure 4.
Snapshots of expression change rates during the IDC. Shown are five key frames of an animation of expression change rates during the IDC where red dots indicate up-regulation and blue dots down-regulation as determined by the rate of expression change. (a) After 8 hours at the beginning of the cycle (ring stage) the central chromosomal regions show an overall down-regulation (blue) while few genes within the subtelomeres are strongly up-regulated (red). (b) After 20 hours (late ring to early trophozoite stage) this is followed by an overall up-regulation in the center regions together with a down-regulation at the chromosomal ends. (c) After 30 hours (late-trophozoite to early-schizont), there is a mixture of strong up-regulation and weak down-regulation over the whole genome without specific subtelomeric activities. (d) After 40 hours (mid-schizont stage) a second strong up-regulation at the chromosome ends can be observed, which is accompanied by weak down-regulation in the intrachromosomal sections. (e) After 44 hour there is, again, an overall up-regulation in central chromosomal regions. Note the alternation of gene regulation between subtelomeric regions and central chromosomal regions. Upper left corner of each frame: 'infection timer' where the red and blue curves represent the number of genes having the strongest up- (red) or down- (blue) regulation at a specific time (density curves over time of strongest positive or negative change of expression; see also Materials and methods).

