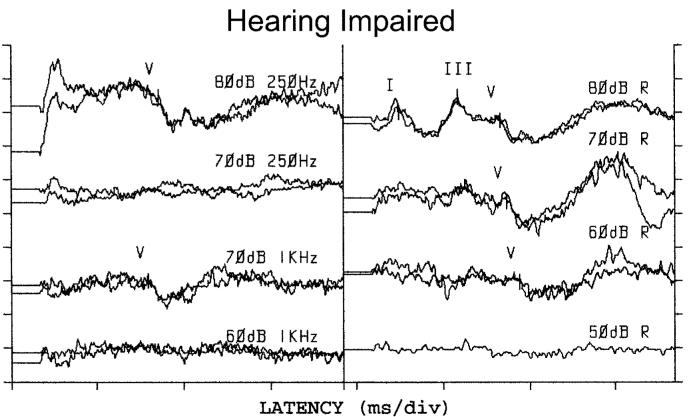
Figure 2.
ABR waveforms in a patient with moderate-to-severe hearing loss, following the convention used in Fig. 1. In this case, however, waveforms are shown at the lowest level at which a response was evident and then at the next lower level. Response epochs for toneburst (left column) and click (right column) responses were 25 ms and 15 ms, respectively.

