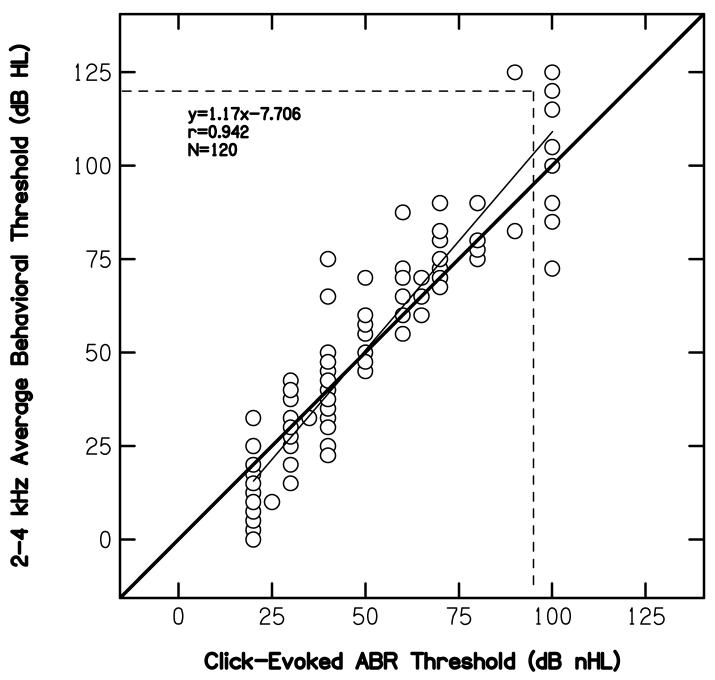
Figure 3.
Average pure-tone behavioral thresholds at 2 and 4 kHz (dB HL) as a function of click-evoked ABR threshold (dB nHL). Horizontal and vertical dashed lines represent cases for which no response was measured. The heavy diagonal line serves as a point of reference, representing the case when there was one-to-one correspondence between pure-tone and ABR thresholds. The thinner, near-diagonal solid line represents a least-squares, linear fit to the data. The equation describing the best-fit line is provided within the panel, along with correlation (r), and the number of cases for which data were available.

