
Fig. 4.
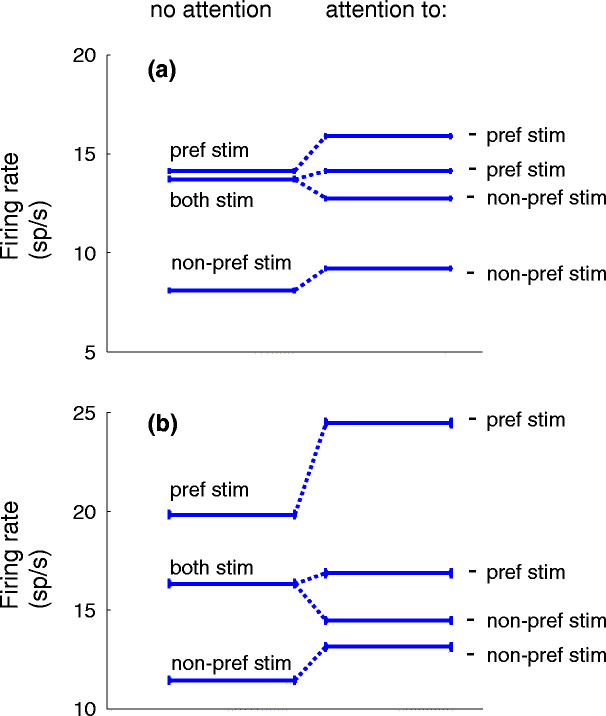
Mean firing rates of neuron Y for different stimulus combinations for the ‘with attention’ and ‘no attention’ condition. (a) Shows the results for small modulation amplitudes A
m (see text), (b) for two times larger modulation amplitudes. The left side shows the results for the ‘no attention’, the right for the ‘with attention’ condition. The firing rate for responses to the preferred stimulus and non-preferred stimulus increases when the preferred or non-preferred stimulus is attended. The firing rate for responses to both stimuli (middle line on the left side) is not the summation of the firing rates for each of the stimuli alone, but is in between. The right side shows that if both stimuli are presented, attention to the preferred stimulus increases the firing rate (second line from the top) and decreases the firing rate when non-preferred stimulus is attended (second line from the bottom of the right side). The following maximum conductance values are used for the simulations to obtain the firing rate results as shown in (a) and (b):  = 0.84 nS,
  = 0.55 nS,
  = 1.52 nS,
  = 1.71 nS and g
inh = 4.50 nS for (a) and g
inh = 3.8 nS for (b)
= 1.71 nS and g
inh = 4.50 nS for (a) and g
inh = 3.8 nS for (b)