
Fig. 8.
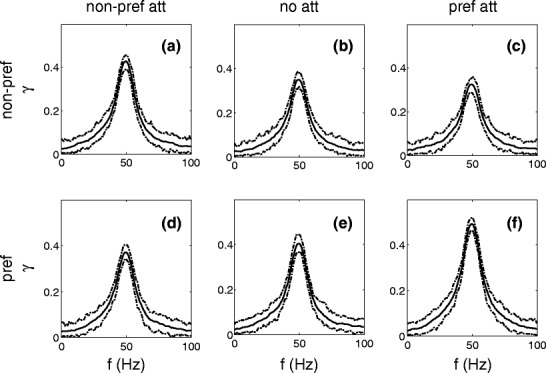
Coherence between the response and the modulation A m η(t) of the non-preferred (upper panels) and of the preferred (lower panels) stimulus for different attention conditions. The middle panels (b and e) show the results when both stimuli are presented simultaneously and unattended. The left panels (a and d) show the coherence when the non-preferred stimulus has been attended, the right panels (c and f) when the preferred stimulus is attended. The 95% confidence level is shown by the dotted lines. Attention to one of the two stimuli results in a significantly larger peak value for the coherence for the attended stimulus and a significantly smaller peak value for the other stimulus