
Fig. 9.
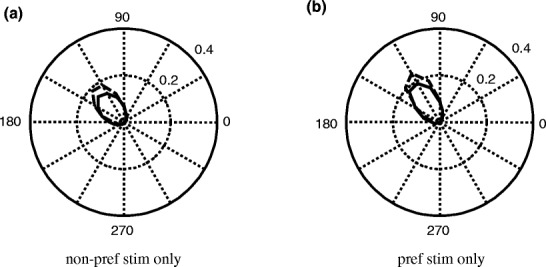
Polar plots of the fraction of phase differences between stimulus and response for the ‘one stimulus only’ condition. The solid (dashed) line shows the polar plots for the ‘no attention’ (‘with attention’) condition. (a) Shows the results for the ‘non-preferred stimulus only’ condition. (b) Shows the ratios for the ‘preferred stimulus only’ condition. The response is better phase locked to the preferred (b) than to the non-preferred stimulus (a); See text for further details)