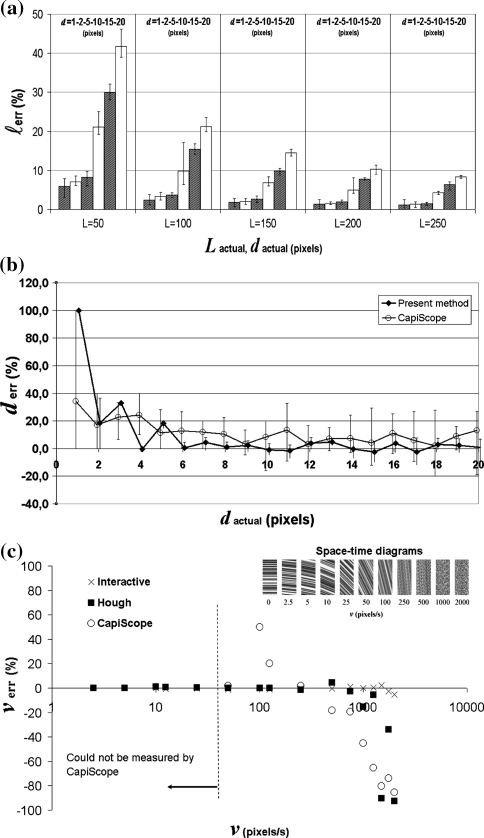
Fig. 2.
Results of evaluation using simulation video. a Average vessel length estimation error (l err) versus actual length (L, pixels) and diameter (d, pixels). b Average diameter estimation error (d err) versus actual vessel diameter (d in pixels). Measurements at whole pixel intervals are slightly shifted apart for clarity. The error bars in both figures indicate the error range due to image noise and vessel orientation as tested in the range [0, 90], with 15° increments. c Accuracy of interactive, automatic (Hough) and CapiScope velocity estimation. The inset shows the space–time diagrams that yielded these results

