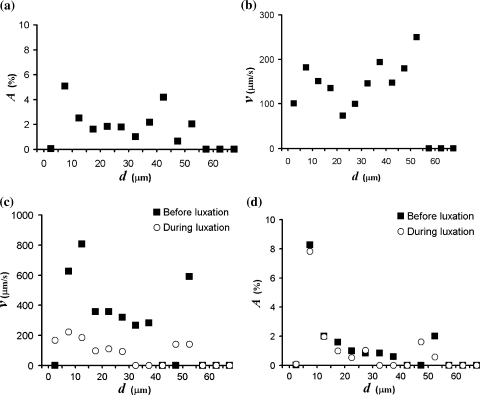
Fig. 4.
Distributions a Sublingual microcirculatory density distribution [A represents the relative image area occupied by vessels in the given diameter (d) range] and, b velocity distribution, both of a healthy male individual. c Velocity distribution, and d functional microcirculatory density distribution, both showing the results before and during the first 10 s of cardiac luxation (see also Fig. 5)

