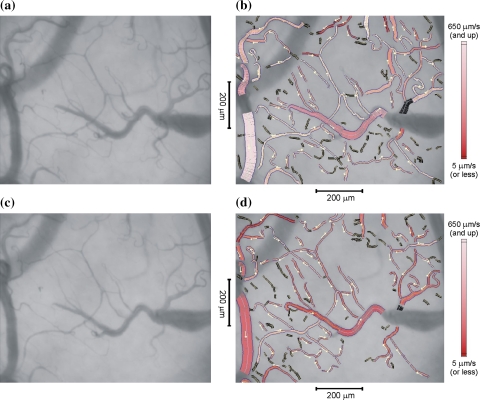
Fig. 5.
a Average frame out of a video sequence showing sublingual microcirculation before a luxation procedure. b Same image as (a) with analysis results superimposed. c Average of frames obtained during a luxation procedure, d with analysis results superimposed. The magnitude of red-blood cell velocity is color-coded in the range [5 (dark), 650 (bright)] μm/s. Vessel segments with space–time diagrams that could not be analysed are marked black. The small arrows indicate the direction of blood flow

