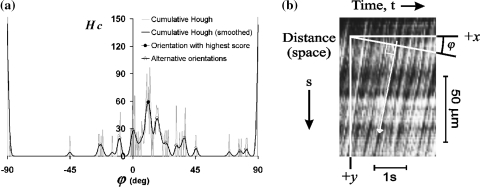
Fig. 7.
a Adding accumulator cells from Fig. 6c that have the same orientation, results in the Hough score diagram (gray curve). Spikes are removed by Gaussian smoothing (black curve). The highest peak identifies the global orientation of lines in the space–time diagram. b Original space–time diagram and the definition of orientation parameter φ. The white arrow indicates the resulting orientation

