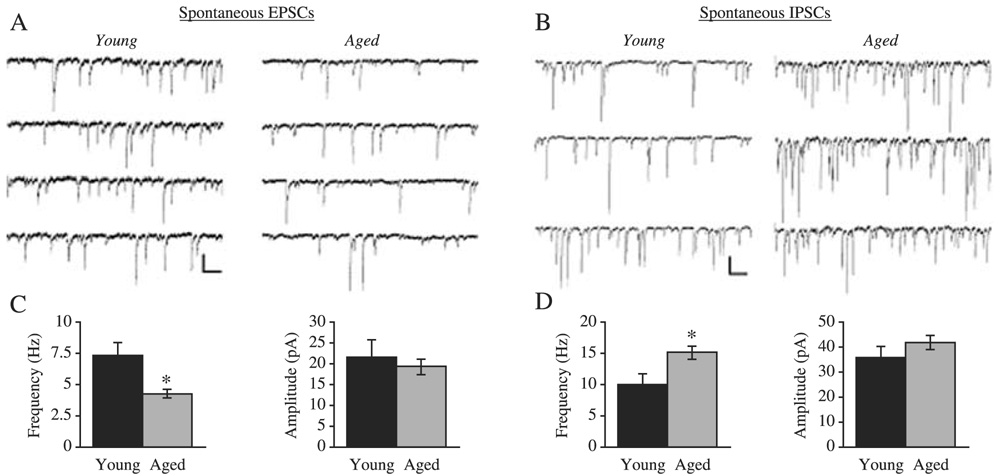
Fig. 2. Decreased frequency of excitatory and increased frequency of inhibitory PSCs in layers 2/3 pyramidal cells from aged monkeys.
(A) Representative traces of spontaneous excitatory PSCs obtained from cells from young (left) and aged (right) monkeys. (B) Representative traces of spontaneous inhibitory PSCs obtained from cells from young (left) and aged (right) monkeys. (C) Bar graphs showing the mean spontaneous EPSC frequency and amplitude values for young vs aged pyramidal cells. (D) Bar graphs showing the mean spontaneous EPSC frequency and amplitude values for young vs aged pyramidal cells. A and B Scale bar: 50 pA, 200 ms.

