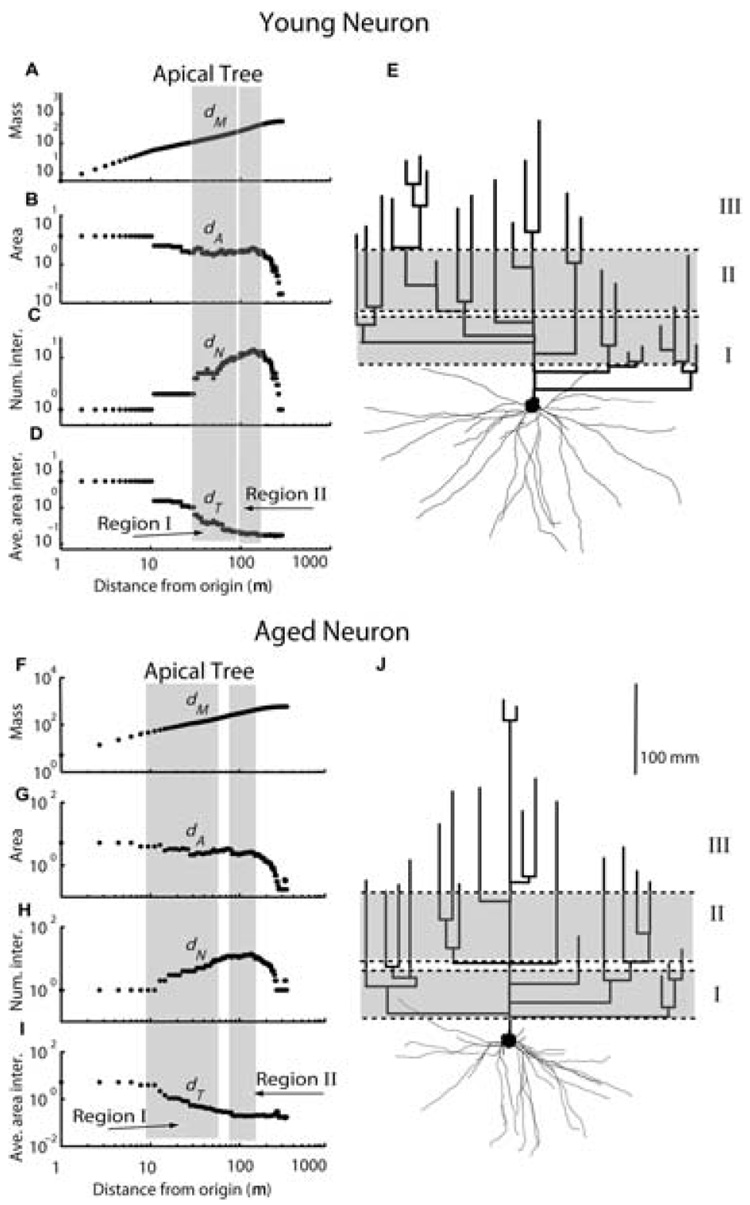
Fig. 3. Scaling regions (gray shaded bands) for a typical young (top panel) and an aged (bottom panel) layer 2/3 pyramidal cell projecting from STC to area 46.
Scaling exponents have been fitted as the slopes of log-log plots of accumulated mass (dM, A,F), cross-sectional area (dA, B,G) branch numbers (dN, C,H), and average area of branch intersections (dT, D,I), with distance from the soma. E,J: Two-dimensional (2D) projection of 3D reconstructed young and aged neurons, in which the basal trees are drawn in anatomical space, whereas the apical trees are drawn in dendrogram space (see Rothnie et al., 2006 for methodological details). Proximal (I), medial (II) scaling regions, and a distal (III) nonscaling or die-off region, are indicated on the dendrogram representation of apical trees.

