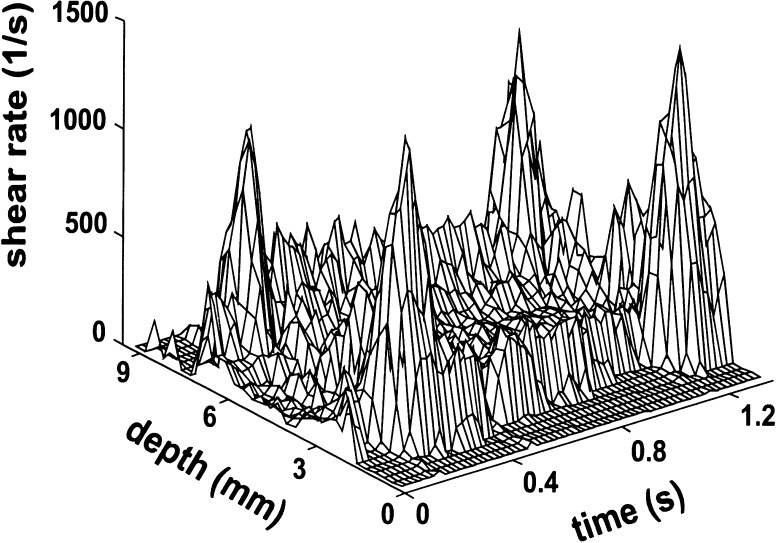
Fig. 2.
Shear rate distribution in the common carotid artery of a presumed healthy volunteer, as derived from the velocity profile in Fig. 1. The shear rate is substantially higher near the wall than in the center of the artery, especially during systole. The peaks near the wall represent the maximum dv/dr as measured 250–300 μm from the wall

