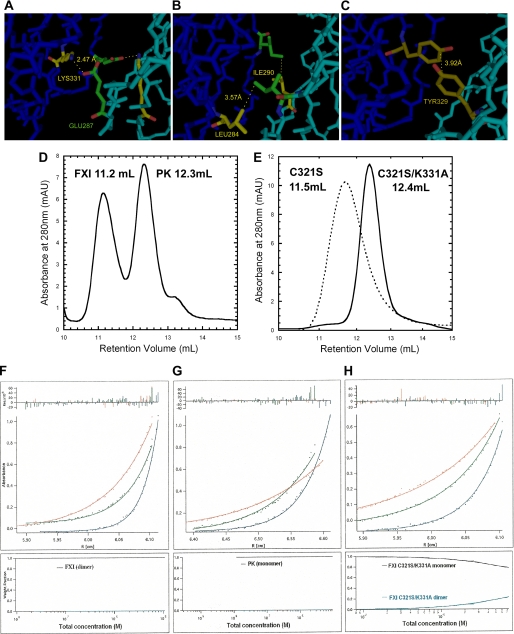
FIGURE 1.
Structure of FXI dimer interface and characterization of FXI mutants by size exclusion chromatography and analytical ultracentrifugation. A–C, structure of the FXI dimer interface based on the crystal structure of FXI (19) predicting a salt bridge between the positively charged Lys-331 residue of one subunit 2.47 Å away from the negatively charged Glu-287 residue on the opposite subunit (A); a hydrophobic interaction (3.57 Å) between Leu-284 and Ile-290 (B); and a hydrophobic interaction (3.92 Å) between the two Tyr-329 residues of the two A4 domains (C). D and E, size exclusion chromatography elution profiles, carried out as described under the “Experimental Procedures.” The retention volumes of purified plasma FXI and PK, 11.2 and 12.3 ml, were adopted as references for dimer and monomer, respectively (D). The mutant FXIC321S migrated with only one peak that had a retention volume, 11.5 ml, similar to that of the FXI dimer, whereas the FXIC321S,K331A mutant displayed a retention volume of 12.4 ml (E), i.e. similar to PK (D). All the other monomeric double mutants also migrated with one predominant peak that had the retention volume around that of PK even at a concentration of 200 μg/ml (data not shown). F–H, equilibrium sedimentation analysis, performed as described under the “Experimental Procedures” at 12,000 rpm (upper curve, red), 15,000 rpm (middle curve, green), and 20,000 rpm (lower curve, blue) for 20–24 h. The radial absorbance profiles (points) and fits (lines) to equations describing equilibrium sedimentation of FXI (F) and PK (G) are shown. The FXIC321S,K331A mutant was selected as a representative of all the mutants as shown in H. The bottom part of each panel showed the species plot of weight fraction against concentration. For FXI and PK, there was only one species (upper black curves); however, the mutant FXIC321S,K331A existed in the equilibrium of dimer (upper black curve) and monomer (lower blue curves), and the dimer species became dominant with the increment of concentration.

