FIGURE 4.
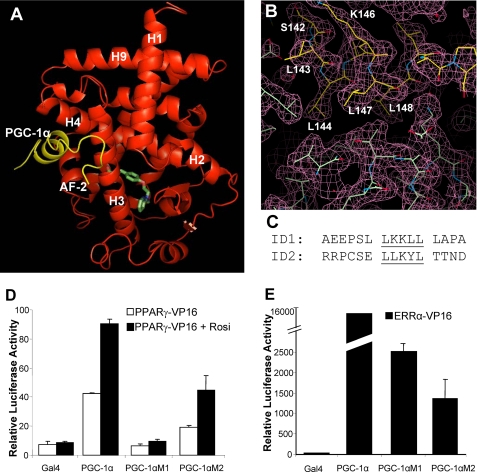
The binding of PGC-1α to PPARγ is through the PGC-1α ID1 LXXLL motif. A, the overall structure of the PPARγ·rosiglitazone·PGC-1α complex in ribbon representation. PPARγ is red, the PGC-1α is in yellow, and the bound rosiglitazone is shown in stick representation with carbon and oxygen atoms depicted in green and red, respectively. B, a 2Fo - Fc electron density map (1.0 σ) showing the binding interface of PPARγ and PGC-1α. C, an alignment of core sequences of PGC-1α ID1 and ID2. D and E, the roles of PGC-1α ID1 and ID2 in the interaction with PPARγ and ERRα. Mammalian two-hybrid assays were performed in COS-7 cells. The PGC-1α fragment that contains both ID1 and ID2 was fused to the Gal4 DNA-binding domain, and the LBDs of ERRα and PPARγ were fused with VP16 AD. The ligand-dependent interaction of PPARγ with PGC-1α was analyzed using 1 μm rosiglitazone (Rosi).

