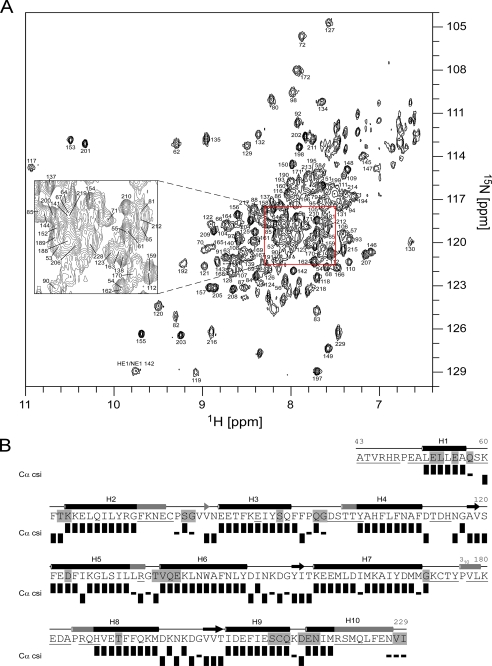
FIGURE 3.
Structural analysis of the KIS-deletion protein KChIP4a(Δ1–42). A, 1H-15N TROSY spectrum of the Ca2+ and Mg2+-loaded KChIP4a(Δ1–42) as in Fig. 1A. The cross peak at 8.64/121.45 ppm marked with an asterisk corresponds to Val136. B, sequence, secondary structure, and schematic representation of NMR data of KChIP4a(Δ1–42) as in Fig. 2A.

