FIGURE 4.
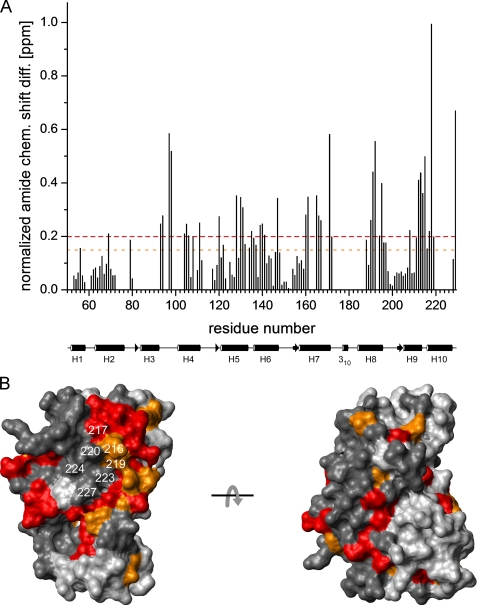
Intramolecular binding site of the KIS domain on the surface of the KChIP4a core identified by chemical shift mapping. A, plot of the normalized backbone amide chemical shift differences (= [Δδ(1H)2 + (0.2 Δδ(15N))2]1/2) (44) between KChIP4a and KChIP4a(Δ1–42) as a function of residue number. The average value is 0.18 ppm. Dashed lines in red and orange indicate differences of 0.2 and 0.15 ppm, respectively. A schematic representation of the secondary structure of the KChIP core with helices H1-H10 is shown below the abscissa. B, surface representation of a structural model (see Fig. 2B) of the KChIP4a core. Residues with chemical shift changes >0.2 ppm are shown in red, those with chemical shift changes between 0.15 and 0.2 ppm are in orange. Residues for which no chemical shift difference is available are in dark gray. H10 residues are identified by their sequence numbers. The two views are related by a 180° rotation around the x-axis. Note the large contiguous surface patch on one side of the molecule that most likely delineates the interaction site between the core region of KChIP4a and the KIS domain.

