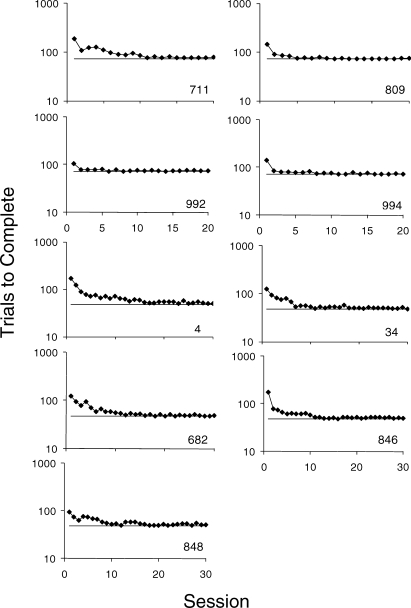
Fig 3.
Number of total trials per session under the correction procedure for the Mid-Course-Correction Group and the Correction-from-Onset group. Solid horizontal line indicates number of correct trials required to complete a session. Y-axis is logged to normalize proportional change across subjects.

