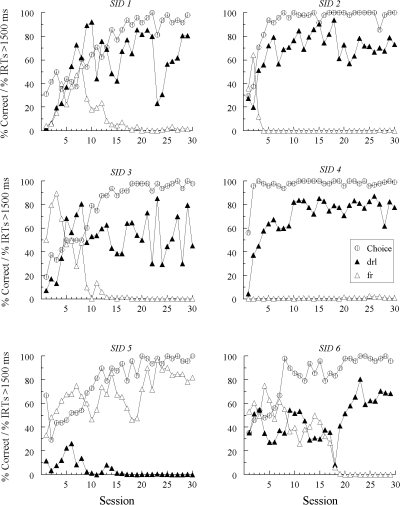
Fig 1.
The percentages of correct choice responses (Choice) and the percentages of sample–response IRTs > 1500 ms with the new (red and green) samples during four-sample matching acquisition for each Group SID pigeon in Experiment 1. IRT data are labeled “drl” and “fr” to reflect the response patterns predicted to emerge to the hue samples based on bidirectional transfer (symmetry) between the explicitly required DRL and FR patterns to the line samples and subsequently reinforced hue-comparison choices.

