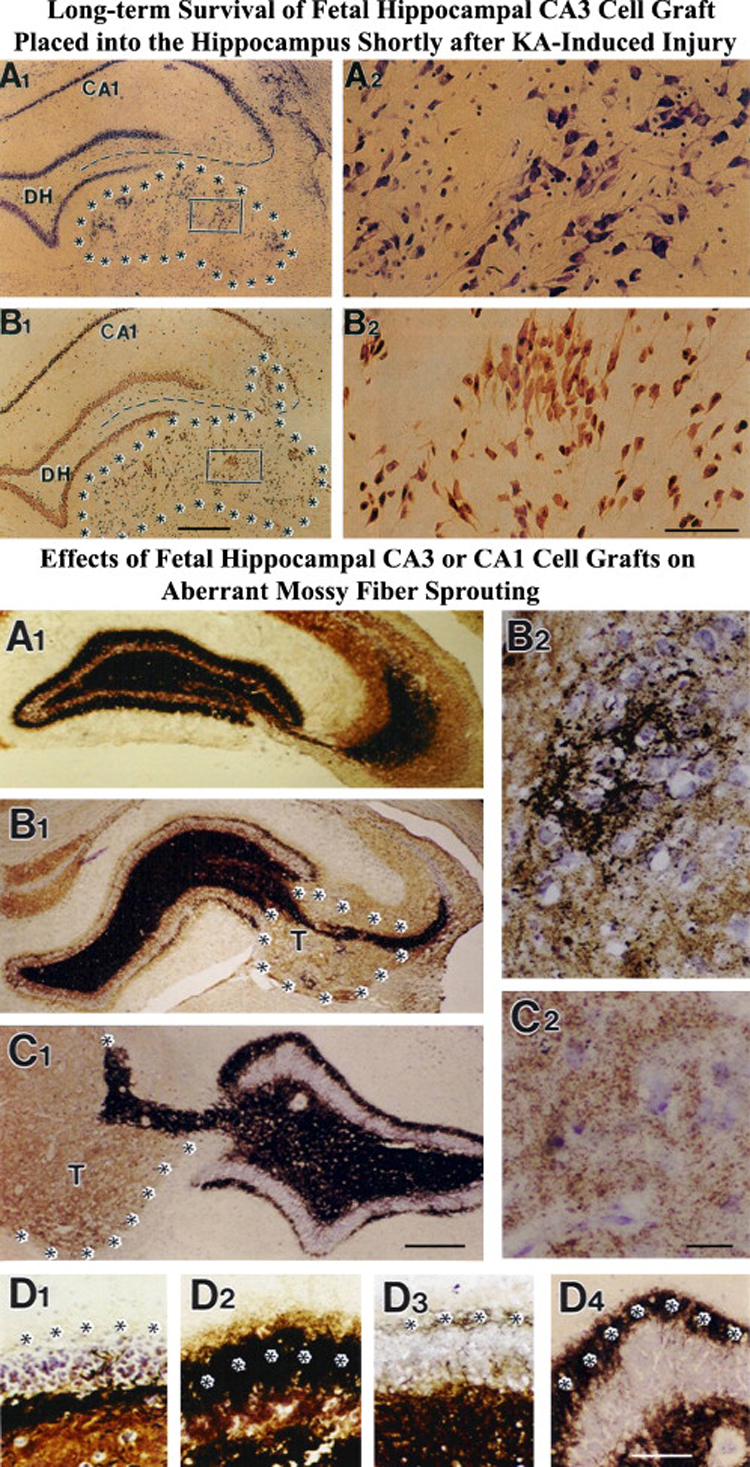
Figure 8.

Top panel: Survival and morphology of fetal CA3 cell grafts placed close to the lesioned CA3 region of the adult hippocampus (marked by asterisks) at 45 days post-lesion and analyzed at 1 year postgrafting. A1 and A2 show a Nissl-stained section of the rat hippocampus containing fetal CA3 transplant (outlined by asterisks) located just below the degenerated CA3 cell layer (indicated by interrupted lines). B1, B2 show NeuN positive neurons within the graft in a neighboring section. DH, dentate hilus. Scale bar: A1, B1 = 400µm; A2, B2 = 50µm. (Reproduced from: Zaman, V and Shetty, AK; 2001; Neurobiol Dis.; 8:942–95). Bottom panel: Effects of CA3 or CA1 cell grafts on aberrant mossy fiber sprouting analyzed at one year post- grafting. Note dense mossy fiber sprouting in the dentate supragranular layer in the lesion only group (A1, D2) and a marked reduction in mossy fiber sprouting (B1, D3) following grafting of fetal CA3 cells but not with CA1 cells (C1, D4). B2 shows dense innervation of fetal CA3 cells grafted into the degenerated host CA3 region by host mossy fibers. C2 shows lack of host mossy fiber growth into the fetal CA1 graft. DH, dentate hilus. Scale bar: Scale bar: A1, B1, C1=500µm; B2, C2, D1–4 = 100µm.
