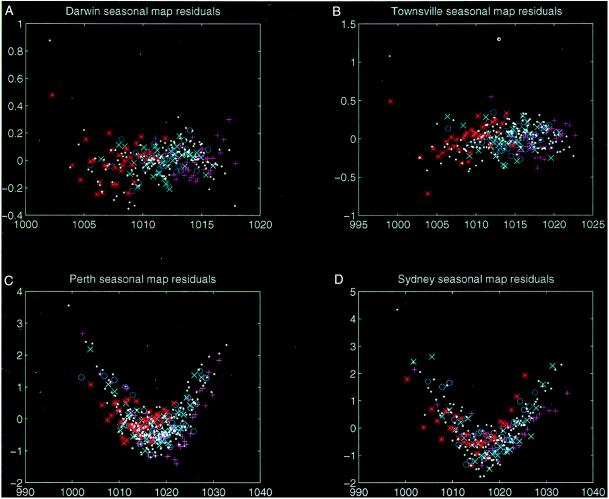
Figure 3.
RDMs of barometric pressure (hPa) at time t, versus the binned residual for the AR3 prediction at time t + 1 for four representative time series shown in Fig. 2 [RDM(AR3)]. The colors correspond to those in Fig. 2 and indicate AR3s for each season. The white points use a single AR3 for the whole year.

