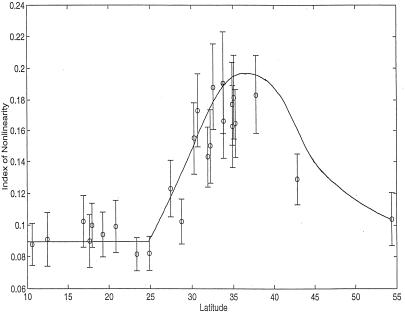
Figure 5.
Index of nonlinearity for the barometric pressure series at each of the 25 locations in Fig. 1. The higher the index, the more nonlinear the series. Error bars indicate 2 standard deviations from the mean for the index. The schematic curve illustrates that tropical dynamics are independent of latitude and that extratropical dynamics have a maximum in nonlinearity which corresponds to the approximate latitude of the average storm track [cf. the covariance plots of Trenberth (11) as a function of latitude].

