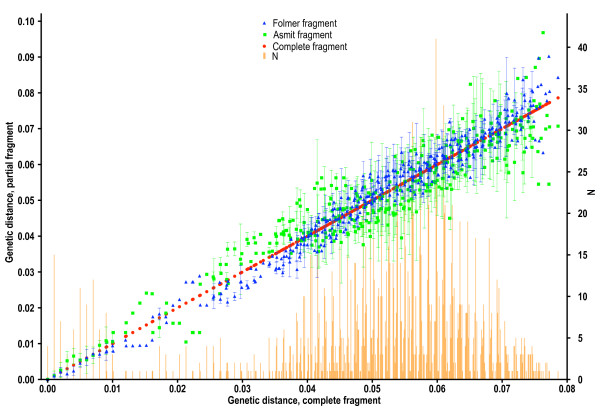
Figure 6.
Comparison of regional cox1 genetic distances using transitions only. Plot showing mean, pair-wise genetic distance values of the 'Asmit' and 'Folmer' regions using transitions only as compared with the corresponding values for the complete fragment. Number of pairs contributing to each value is shown graphically.

