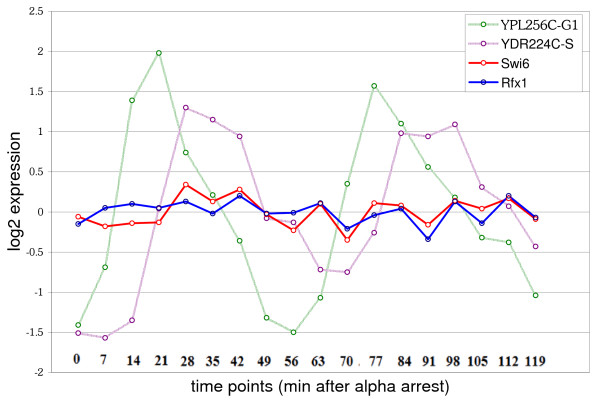
Figure 3.
Swi6 and Rfx1 in the Cell Cycle. The Log2 expression values of Swi6 and a newly predicted target, Rfx1 (also a TF) during 2 cell cycles (original data from [32]). G1 and S-Phase are marked by the expression of two prototype genes, YPL256C and YDR224C, which are known to have peak expression in G1 and S-phase, respectively. Time points are indicated in minutes after alpha factor arrest. Swi6 and Rfx1 show correlated expression during the cell cycle. Time points at 21 min–42 min, and 77 min–98 min are the 8 time points mentioned in the text which show higher correlation.

