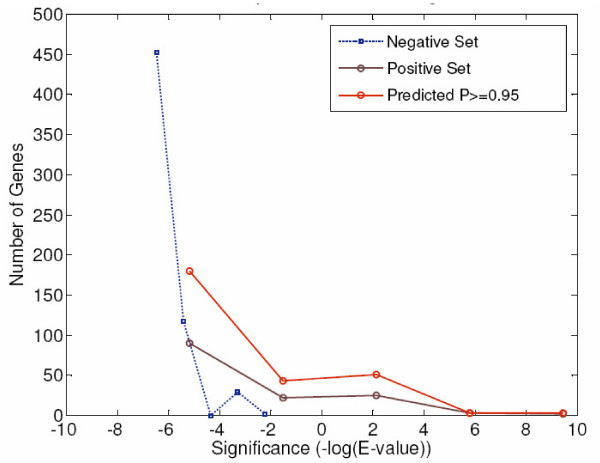
Figure 5.
Overrepresentation of ACGCG in Swi6 Target Promoters. This plots the number of genes versus the E-value of ACGCG in groups of target promoters. Three categories of promoters are shown: (i) negative set promoters in blue, (ii) positive set promoters in violet, (iii) predicted targets at P ≥ 0.95. For each category, genes are grouped into 5 equally spaced bins based on the E-value of overrepresentation of ACGCG. The center locations of those bins are plotted on the x axis and the number of genes in each bin is on the y axis. Positive and predicted target promoters of Swi6 show higher overrepresentation of ACGCG than negative set genes.

