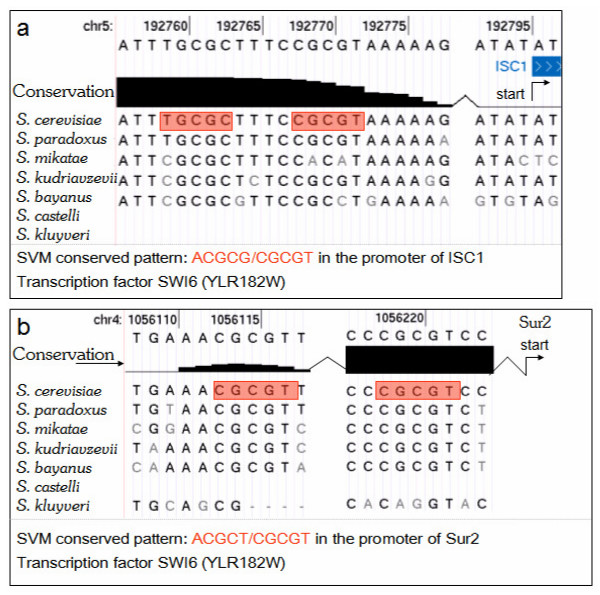
Figure 6.
Conservation of ACGCG in Swi6 Target Promoters. This figure shows multi-genome alignments of selected promoter regions of Swi6 targets taken from the UCSC Genome Browser. Instances of ACGCG and its reverse complement are highlighted in red. The diagram is based on scores which are output fom the PhastCons algorithm and are pre-calculated on the UCSC Genome Browser website. The score is a posterior probability assigned to each nucleotide, giving the likelihood that the nucleotide resides in a conserved element, as defined by a hidden Markov model of "slow" and "fast" evolution. A) alignment in the promoter region of ISC1, showing two instances of the ACGCG motif. B) alignment in the promoter region of Sur2, also showing two instances of the conserved motif.

